
Let’s explore Bearish Candlestick Patterns that indicate a possible end of an ongoing uptrend and a potential reversal to a downtrend, but before that, it’s important to have a basic understanding of candlestick chart patterns.
Bearish Reversal Candlestick Patterns can appear as a single or multiple candlestick patterns. It’s crucial to note that these patterns should occur at the end of an uptrend to signal a reversal and not be mistaken as a continuation pattern.
It’s advisable to confirm the reversal signals given by bearish reversal patterns using other indicators like volume and resistance.
In this blog we will be discussing 5 Powerful Bearish Candlestick Patterns:
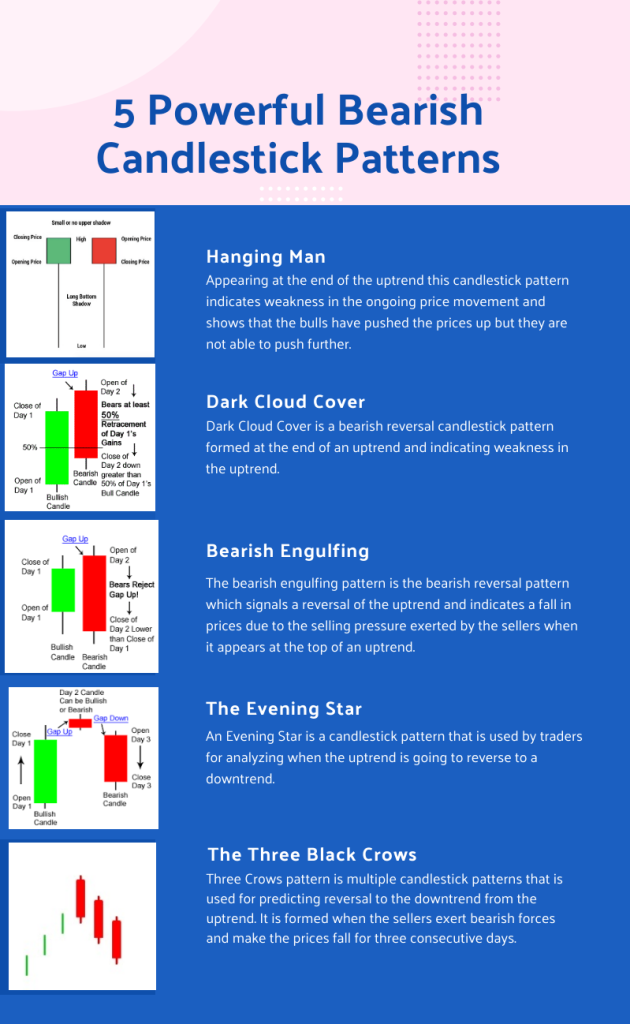
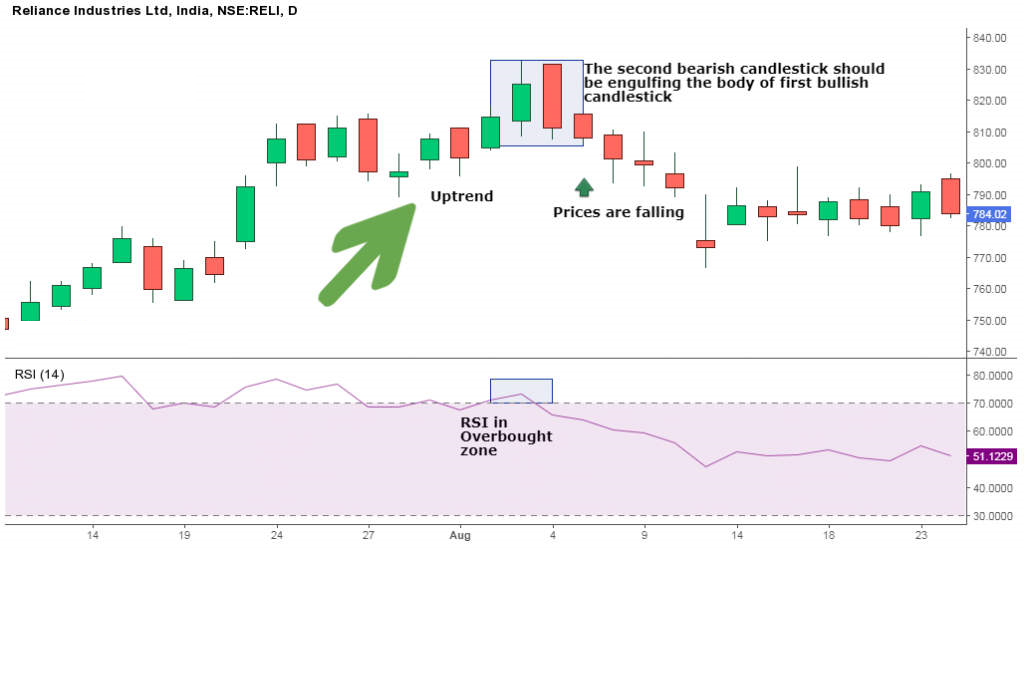
- Bearish Engulfing Pattern – This pattern consists of a small bullish candle followed by a larger bearish candle that completely engulfs the previous candle’s body. It indicates a potential reversal of an uptrend.
When this pattern emerges, it signals a reversal of the ongoing uptrend as sellers enter the market, causing prices to drop. This pattern comprises of two candles, with the second one being bearish and engulfing the body of the preceding bullish candle.
Here is an example of Bearish engulfing pattern:
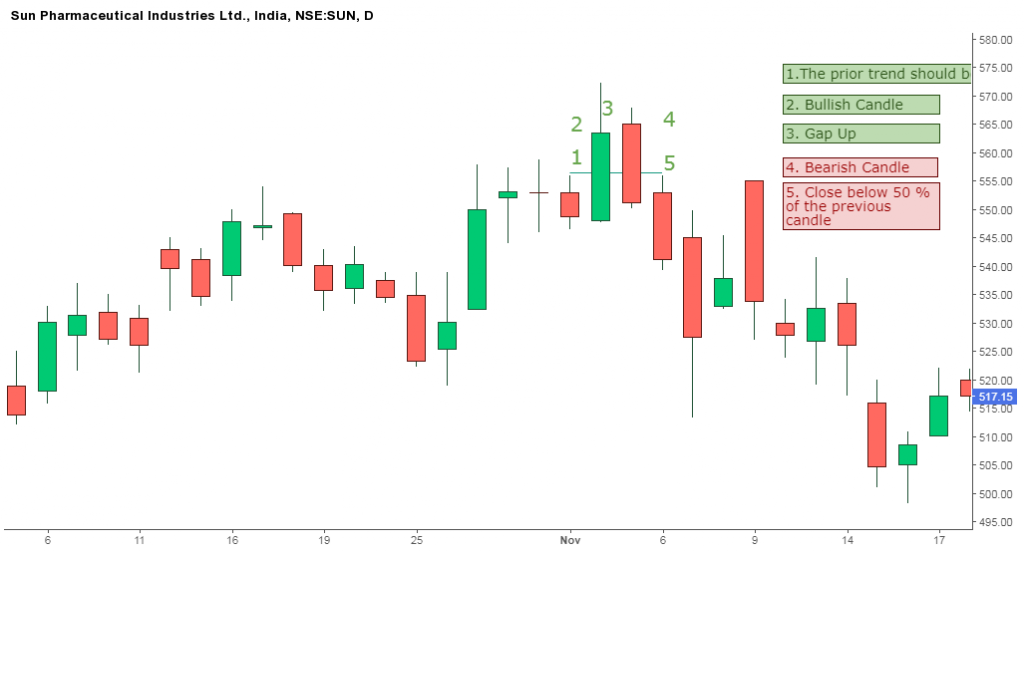
2. Dark Cloud Cover – This pattern occurs when a bullish candle is followed by a bearish candle that opens above the previous candle’s high but closes below its midpoint. It suggests a potential reversal of an uptrend.
Consisting of a bullish candlestick followed by a bearish candlestick, this candlestick pattern gains significance for a potential reversal to the downside as prices increase.
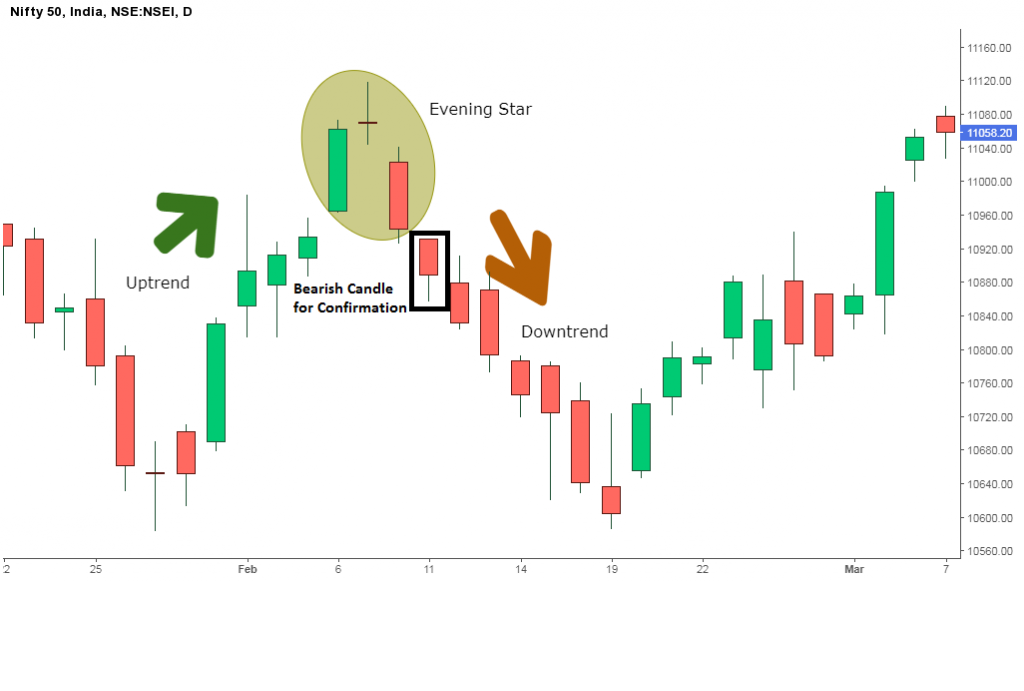
3. Evening Star – This pattern consists of a bullish candle, followed by a small candle with a gap up, and then a bearish candle that closes below the midpoint of the first candle. It signals a potential reversal of an uptrend.
Comprising of a sizable bullish candlestick, a small-bodied candle, and a bearish candlestick, this candlestick pattern is known as the Evening Star. It typically emerges at the peak of an uptrend and serves as an indication of an upcoming reversal to a downtrend.
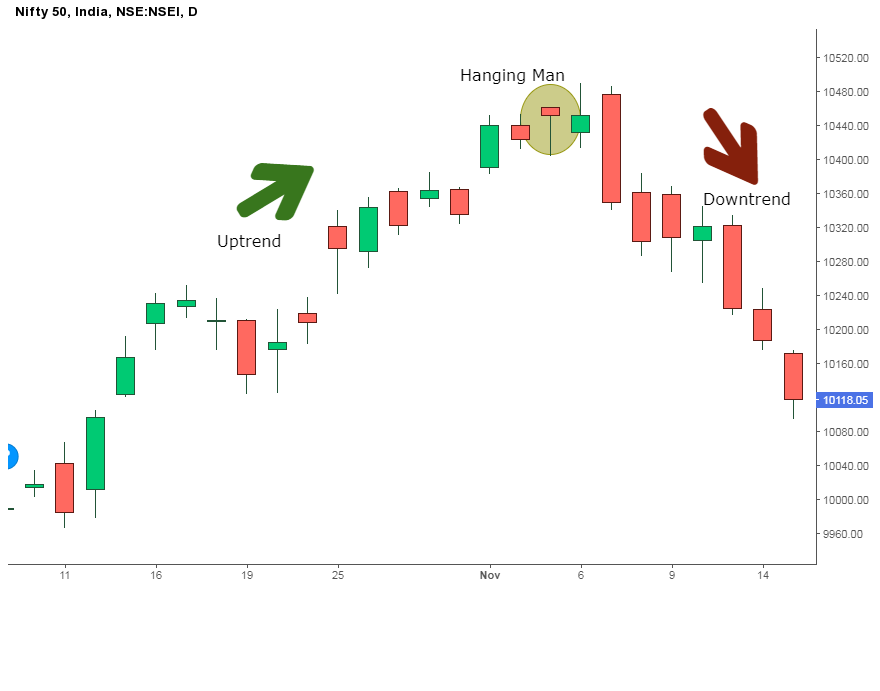
4. Hanging Man – This pattern occurs when a small bullish candle with a long lower shadow is followed by a bearish candle. It suggests a potential reversal of an uptrend.
This bearish candlestick pattern emerges towards the conclusion of an uptrend and implies a lack of strength in the ongoing price movement. It suggests that although the bulls managed to push prices up, they are now struggling to make further gains. The pattern’s small real body signifies a short distance between its opening and closing price, while the absence of an upper shadow and a lower shadow that is twice the length of its body are also characteristic features.
5. Shooting Star – This pattern is the opposite of the hanging man and occurs when a small bearish candle with a long upper shadow is followed by a bullish candle. It suggests a potential reversal of a downtrend.
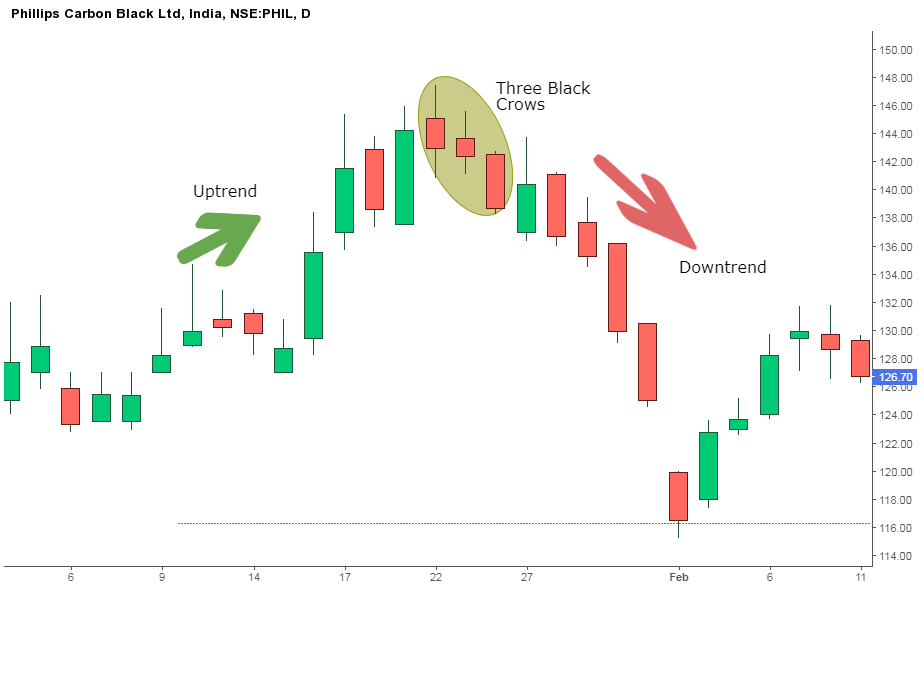
This candlestick pattern takes shape as a result of three consecutive days of downward pressure by sellers, causing prices to decline. Once formed, traders may choose to take a short position. It’s important to verify the formation of this candlestick pattern using volume and technical indicators.
Bearish candlestick patterns can be useful for identifying potential entry and exit points in trades, but traders should always use other technical analysis tools or can join technical analysis course and consider market conditions before making any trading decisions.